Night setback is one of the simplest parameters to adjust in the control system of a communal boiler plant. Yet in many buildings it is either absent or ineffective: nighttime indoor temperatures remain almost identical to daytime temperatures, resulting in unnecessary gas consumption.
This article presents an analysis of data collected from two residential buildings between March 15 and April 3, 2026, before and after a change to the control settings. The aim is to observe how this change translated into the indoor temperature curves, and to draw lessons from it about the thermal dynamics of these buildings.
Observation protocol
Buildings
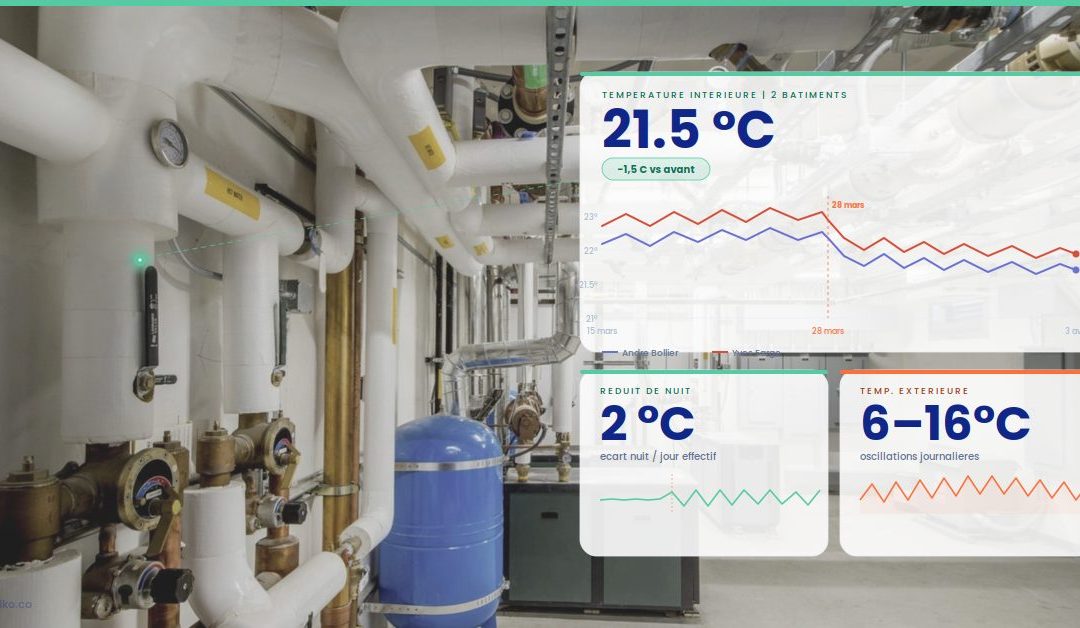
The two buildings, referred to here as André Bollier and Yves Farge, are residential buildings with communal heating, controlled by the same heating loop. The dwellings are fitted with indoor temperature sensors that allow continuous monitoring of the average temperature per building.
The period
The observation period spans 19 days, from March 15 to April 3, 2026. It is divided into two distinct phases:
- Phase 1 (March 15–27): observation with no change to the setpoint, baseline state
- Phase 2 (March 28–April 3): observation after the night setback was changed
Phase 1: thermal state before the change (March 15–27)
Indoor temperatures observed
In this first phase, both buildings show high and stable average indoor temperatures:
| Building | Average indoor temperature | |
|---|---|---|
| Bollier | ~22–23 °C | < 0,5 °C |
| Farge | ~22,5–23,5 °C | < 0,5 °C |
A night/day variation below 0.5°C indicates that the night setback, if it was set at all, had no measurable effect on the indoor temperature. The buildings maintained a near-constant temperature over 24 hours.
Interpretation
Several factors can explain this lack of an effective setback:
- High thermal inertia: concrete or stone buildings store heat and release it slowly. If the supply setpoint is not lowered early enough or sharply enough, the inertia offsets the setback before it can translate into indoor temperature.”
- Insufficient setback value: lowering the supply temperature by 2 to 3°C may not be enough to produce a visible effect indoors if the building is well insulated or if internal gains (occupants, electrical appliances, sunlight) are significant.
- Poorly timed schedule: if the setback starts too late or ends too early, the window of reduction is too short to show up in the hourly averages.
In this specific case, the high temperatures (~23°C) also point to structural overheating: the building heats more than necessary to reach the regulatory comfort level (19°C when occupied, under Article R.131-20 of the French Construction Code).
The parameter that was changed
On March 28, two adjustments are made to the heating loop’s control settings: a reduction of the daytime supply setpoint, since the building was structurally overheated (~23°C for a regulatory comfort level of 19°C), and a further reduction over the nighttime period, in order to activate an effective night setback. No physical changes are made to the system.
Phase 2: behavior after the change (March 28–April 3)
Évolution des températures intérieures
As early as March 29 (D+1), the temperature curves of both buildings change markedly:
| Building | T° before change | T° after change | Average difference |
|---|---|---|---|
| Bollier | ~23 °C | ~21,5 °C | −1,5 °C |
| Farge | ~23,5 °C | ~22 °C | −1,5 °C |
The night/day variation goes from less than 0.5°C to about 2°C, which confirms that the night setback is now effective and visible in the indoor data.
What the curves show
Three phenomena are visible in the post-change data:
1. The nighttime descent
The indoor temperature starts to drop in the evening, follows a steady slope through the night, and reaches its minimum in the late night / early morning. This profile is characteristic of a building whose heat input is reduced during the nighttime period and whose thermal inertia gradually accompanies the descent.
2. The morning recovery
The temperature rise in the morning is fast and consistent with a return to the normal setpoint. The building’s thermal inertia plays a positive role here: the mass of the structure quickly absorbs heat from the heat-transfer fluid during the restart, which limits the time needed to climb back up.
3. The consistency between the two buildings
The two buildings, though distinct, respond very similarly to the same setpoint change. This indicates that their thermal characteristics (inertia, heat loss, occupancy) are close, and that the control system is well sized for both.
Analysis: why is the drop 1.5°C and not more?
The 1.5°C drop in the 24-hour average results from the combination of the two adjustments, not from the night setback alone:
- Lowering the daytime setpoint brings down the building’s daytime baseline (the daytime peak goes from around 23°C to ~22.5°C), directly correcting the overheating.
- <The nighttime reduction creates a drop of about 2°C in the late night, now visible in the day/night variation (from 0.5°C to ~2°C). On top of this comes a second-order effect, well known in building thermal science: since the nighttime recovery is not quite complete before the next descent, the setback also contributes, marginally, to lowering the average. But most of the drop in the average comes from correcting the daytime overheating, not from a “shift in the equilibrium point” driven by the setback alone.

Methodological takeaways
Limiting confounding variables
Over this period, the outdoor temperature continued to fluctuate normally across the two phases. For a rigorous analysis, it would ideally be necessary to:
- Compare against a control building left unchanged over the same period
- Normalize the data against the outdoor temperature (heating degree days)
- Extend the post-change observation period to smooth out transient effects
The data presented here gives a robust indication, but a degree-day analysis would make it possible to quantify the associated energy savings more precisely.
The thermal time constant as a key indicator
The speed at which a building responds to a setpoint change depends on its thermal time constant τ, which reflects the ratio between its thermal capacity (inertia) and its heat loss. A building with a time constant of 20h will respond much more slowly to a setback than a building with τ = 8h.
At André Bollier and Yves Farge, the response visible as early as D+1 suggests relatively short time constants, which makes these buildings particularly responsive to setpoint control.
Comfort threshold and room for maneuver
The post-change temperatures (21.5°C and 22°C) remain above the regulatory threshold of 19°C during occupancy. The initial margin was therefore large (~4°C of overheating), which explains why a 1.5°C drop did not cause any discomfort. In buildings already close to the threshold, the same adjustment would produce a different effect.
Conclusion
This analysis illustrates how a simple parameter change — adjusting the night setback — can produce a measurable effect on the indoor temperature of a building with communal heating, visible the day after activation.
Key takeaways:
- An ineffective night setback is common in buildings with communal heating, even when it is formally configured
- A building’s response depends on its thermal inertia: the lower it is, the more effective and faster the setback
- A significant initial overheating (>> 2°C above comfort level) is the favorable condition for effective control without risk of complaints
- The consistency of the response across two distinct buildings on the same heating loop validates the relevance of centralized control
The natural next step would be to cross-reference this temperature data with gas consumption data, in order to precisely quantify the energy savings in kWh and as a percentage of seasonal consumption.
Data collected via the continuous monitoring system of the Kocliko platform, period from March 15 to April 3, 2026.
Kocliko
Recent Comments