The KOCLIKO platform is enhanced with a new feature: 3D building visualization directly within the manager’s interface. This 3D KOCLIKO allows for a more intuitive representation of a residence and enables observation of the thermal situation dwelling by dwelling.
Thanks to this new interface, managers and operators can visualize the temperature of dwellings directly at the building scale. A simple color code makes it possible to immediately identify colder dwellings, those overheating, and those within the thermal comfort zone. This approach offers a new way to interpret energy data and better understand a residence’s thermal behavior.
A 3D Model Based on the Building’s Digital Model
The 3D KOCLIKO relies on the building’s digital model, which describes its structure and internal organization. This model contains detailed information on the various elements that make up the residence, such as floors, dwellings, rooms, and architectural volumes.
From this data, the platform generates an interactive 3D model of the building directly within the Kocliko interface, allowing for intuitive navigation within the residence and visualization of dwelling positions.
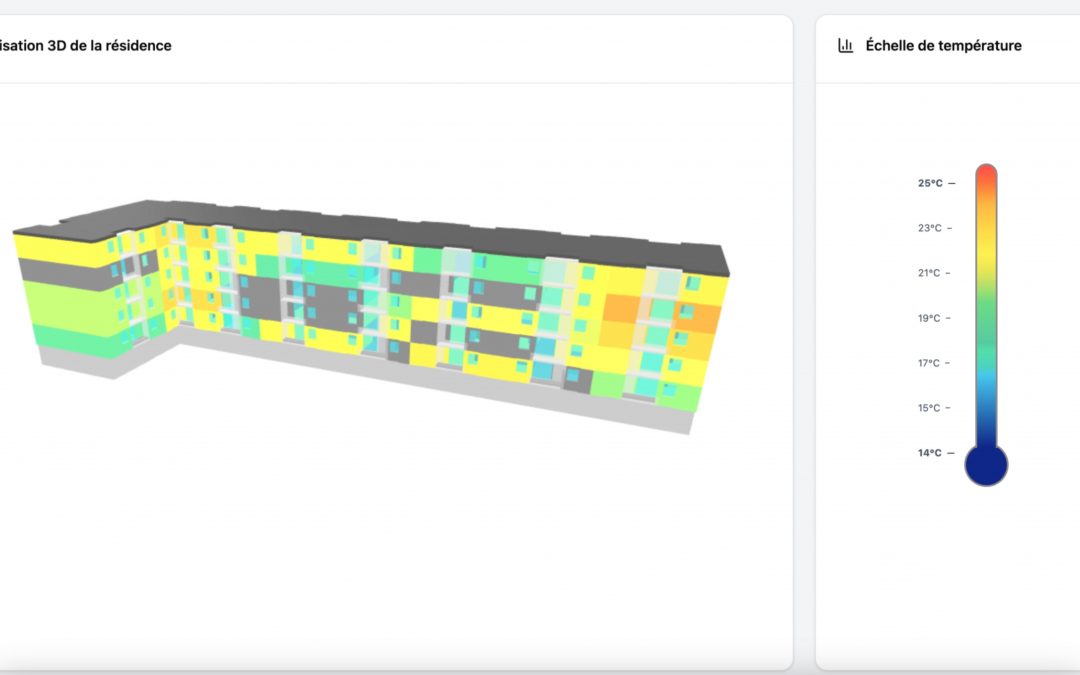
Visualize the Temperature of Each Dwelling
The 3D KOCLIKO is not limited to building representation. It also integrates data from sensors installed in dwellings, particularly ambient temperature measurements.
Each dwelling represented in the model is associated with the corresponding sensors in the KOCLIKO platform. The collected data is then displayed directly in the 3D visualization. This makes it possible to observe the temperature of each dwelling at the building scale and quickly compare thermal situations between apartments.
This representation also facilitates the identification of atypical situations, such as an overheating dwelling or an insufficiently heated apartment.
A More Intuitive Reading of Energy Data
To facilitate interpretation, dwellings are colored according to their temperature. A color code ranging from blue to red allows for immediate identification of colder or warmer areas within the building.
This spatial representation transforms the way energy data is observed. Where analysis traditionally relied on tables or graphs, 3D KOCLIKO now allows for direct visualization of information within the building’s structure. Data thus becomes much simpler to understand and analyze.
A New Analysis Tool for Technical Teams
By combining the building’s digital structure with data reported by sensors, 3D KOCLIKO offers a new way to explore the thermal performance of residences.
Technical teams can thus quickly visualize the thermal situation of a building, understand any discrepancies between dwellings, and more easily analyze the overall behavior of the building. This interpretation facilitates the identification of abnormal situations and allows for more effective intervention when necessary.
With this feature, KOCLIKO continues its objective: to make energy data more readable and operational to better understand buildings and improve their management.
Recent Comments